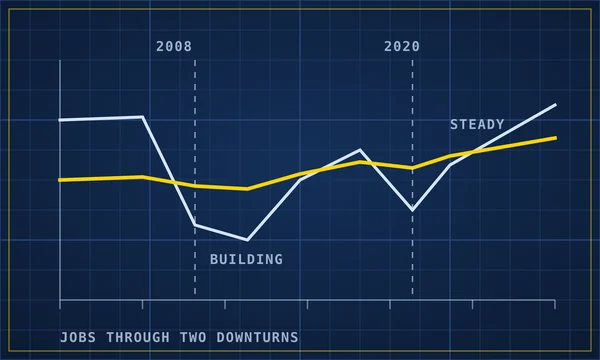
When the housing market crashed, U.S. jobs fell 6% from 2008 to 2010. Skilled trades that build new homes fell much further: plasterers lost 39% of their jobs and tile setters 38%. Trades that fix and maintain things held steady. Riggers grew 1.3%, and pest control technicians, septic & sewer technicians and industrial machinery mechanics each changed by less than 2%.
The pattern is simple: people stop building when money is tight, but they still need pests treated, septic systems pumped, power lines fixed and factory machines running. Only 6 of the 40 trades with figures for both years lost fewer jobs than the economy as a whole. The 2020 shutdown was different: it was short, and construction was mostly kept open, so most trades fell less than all jobs did (5%).
How each trade held up
Change in U.S. jobs. Click a column to sort. “Since 2008” compares May 2008 with May 2025.
| Trade | 2008 to 2010 | 2019 to 2020 | Since 2008 | Typical pay |
|---|---|---|---|---|
| Rigger | +1% | -6% | +54% | $60,455 |
| Pest Control Technician | -1% | +0% | +58% | $44,460 |
| Septic & Sewer Technician | -2% | +0% | -3% | $50,990 |
| Industrial Machinery Mechanic | -2% | -0% | +52% | $63,865 |
| Telecom Equipment Installer | -3% | -9% | -30% | $62,240 |
| Electrical Lineworker | -5% | +3% | +4% | $96,805 |
| Maintenance Technician | -7% | -4% | -4% | $48,330 |
| Telecom Line Installer | -7% | +1% | -43% | $66,250 |
| Building Inspector | -7% | +3% | -12% | $67,380 |
| Auto Mechanic | -10% | -5% | +4% | $48,885 |
| Landscaper | -10% | -4% | -9% | $37,540 |
| Diesel Mechanic | -10% | -5% | -1% | $60,355 |
| Appliance Repair Technician | -11% | -11% | -14% | $50,540 |
| Auto Body Repairer | -12% | -5% | +1% | $51,680 |
| Hazmat Removal Worker | -13% | -1% | +17% | $48,215 |
| HVAC Technician | -14% | +1% | +48% | $59,590 |
| Ironworker | -15% | -7% | -1% | $64,000 |
| Paving Equipment Operator | -15% | -3% | -42% | $49,920 |
| Machinist | -16% | -6% | -33% | $57,050 |
| Heavy Equipment Operator | -16% | -1% | -1% | $59,670 |
| Roofer | -17% | -1% | +12% | $50,140 |
| Insulation Installer | -18% | -2% | +56% | $48,305 |
| Construction Supervisor | -18% | -2% | +30% | $77,215 |
| Plumber | -18% | -6% | +1% | $61,430 |
| Elevator Installer | -19% | -13% | -7% | $108,250 |
| Electrician | -19% | -5% | +15% | $62,440 |
| Fence Installer | -19% | +4% | -5% | $48,410 |
| Sheet Metal Worker | -20% | -2% | -30% | $61,460 |
| Welder | -20% | -3% | +5% | $52,285 |
| Glazier | -21% | -0% | +13% | $55,240 |
| Construction Laborer | -24% | -5% | +4% | $46,850 |
| Painter | -24% | -6% | -15% | $47,640 |
| Concrete Finisher | -30% | -0% | +1% | $57,245 |
| Carpenter | -31% | -5% | -27% | $56,155 |
| Rebar Worker | -32% | -1% | -52% | $56,835 |
| Flooring Installer | -33% | +3% | +66% | $55,870 |
| Brickmason | -36% | -1% | -51% | $62,950 |
| Drywall Installer | -36% | -3% | -35% | $53,860 |
| Tile Setter | -38% | -6% | -30% | $50,495 |
| Plasterer | -39% | -8% | -56% | $58,820 |
BLS Occupational Employment and Wage Statistics, national estimates for May of each year. BLS cautions that these surveys aren't built for year-to-year comparison, and a few job codes changed over time (maintenance technicians were coded 49-9042 before 2019), so treat small differences as noise. Solar and wind technicians weren't counted in 2008.
Steady work is one part of the choice. The retirement wave shows where older workers will leave openings, and pay without a degree ranks every trade by pay.
Steady and well paid
These trades lost 11% of their jobs or less in the crash (all jobs fell 6%) and pay a typical $55,000 or more:
- Electrical Lineworker: -5% in 2008 to 2010, typical pay $96,805
- Building Inspector: -7% in 2008 to 2010, typical pay $67,380
- Telecom Line Installer: -7% in 2008 to 2010, typical pay $66,250
- Industrial Machinery Mechanic: -2% in 2008 to 2010, typical pay $63,865
- Telecom Equipment Installer: -3% in 2008 to 2010, typical pay $62,240
- Rigger: +1% in 2008 to 2010, typical pay $60,455
- Diesel Mechanic: -10% in 2008 to 2010, typical pay $60,355
Biggest comebacks since 2008
A big drop isn't the whole story. Some trades lost jobs in the crash and then grew well past where they started. Change in U.S. jobs from May 2008 to May 2025:
Hit hardest in 2020
The 2020 shutdown hit trades that work inside homes and businesses or depend on new equipment orders the most:
- Elevator Installer: -13%
- Appliance Repair Technician: -11%
- Telecom Equipment Installer: -9%
- Plasterer: -8%
- Ironworker: -7%
Common questions
What is the most recession-proof trade?
In the 2008 to 2010 crash, riggers held up best (+1%), followed by pest control technicians and septic & sewer technicians.
Which trades were hit hardest in 2008?
Trades tied to new home building: plasterers (-39%), tile setters (-38%) and drywall installers (-36%).
Are electricians and plumbers recession-proof?
Not fully. In 2008 to 2010, electrician jobs changed -19% and plumber jobs -18%, against -6% for all jobs. Repair and service work held up better than new construction.
How was 2020 different?
It was short, and construction was mostly allowed to keep working. All U.S. jobs fell 5% from May 2019 to May 2020, and most trades fell less.