Statewide pay Government data
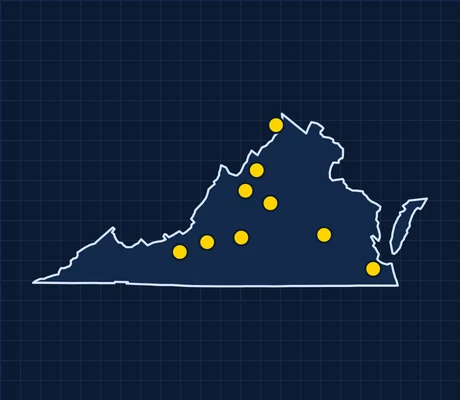
Insulation installers in Virginia earn a statewide median of $44,810 a year, 7% below the typical U.S. metro, ranking #42 of 48 states. About — people work in the trade statewide.
Statewide pay range
States ranked near Virginia
See all states on the insulation installer overview.
Pay by city Government data
BLS publishes insulation installer pay for 2 Virginia metros: Virginia Beach and Lynchburg.
| Metro | Median pay | Real pay | Jobs |
|---|---|---|---|
| Virginia BeachVIRGINIA · VA | $43,730 | $44,649 | 160 |
| LynchburgVIRGINIA · VA | $38,230 | $42,781 | 50 |
Pay: BLS OEWS, May 2025 (metro-level). Real pay: BEA price parities, 2024. How we calculate
The job (national)

Line and cover structures with insulating materials. May work with batt, roll, or blown insulation materials.
Nationally, jobs are projected to grow 2.4% from 2025 to 2035, with about 3,000 openings a year. Typical training: short-term on-the-job training.
Nationally, insulation installers have 312 injuries or illnesses serious enough to miss work per 10,000 full-time workers, 3.6× the rate for all jobs (87). The most common cause is falls, slips and trips.
What the work is like Government data
How often insulation installers deal with each condition, from surveys of workers in the job.
Getting started usually takes some preparation (high school plus months of training).
O*NET 31.0 Work Context and Job Zones (U.S. Department of Labor), national.
Registered apprenticeships Government data
Of insulation installer apprentices in Virginia who finished or left a registered program in fiscal years 2020–2024, 7% completed (U.S.: 42%), about 1 graduates a year. The typical program runs 8,000 hours, about 4 years of full-time work. Search open registered programs near you on the official Apprenticeship Finder.
U.S. Department of Labor, RAPIDS apprentice records (Completion Rate Analysis), FY2020–2024 exits.
Serious injuries & deaths reported to OSHA Government data
Virginia runs its own workplace-safety program (an OSHA State Plan), so its injury reports aren't in the federal dataset. Nationally, in states federal OSHA covers, drywall and insulation contractors filed 512 severe injury reports from 2015 to 2024; the most common cause was falls, slips and trips (67%).
OSHA Severe Injury Reports, January 2015–December 2024 (states under federal OSHA only).
Fatality investigations: OSHA Fatality Inspection Data, events 2015–2024, all states.
Licensing in Virginia Official source
The main state licensing office in Virginia is the Virginia Department of Professional and Occupational Regulation. It can point you to the right license for insulation installers.
Official Virginia licensing site ↗
Requirements for insulation installers vary by state and sometimes by city; always confirm with the official agency.
Union membership
In 2025, 5.4% of wage and salary workers in Virginia were union members, below the U.S. rate of about 10% (#38 of 51 states and D.C.), and 6.4% were covered by a union contract. These figures cover all jobs in the state, not only insulation installers.
BLS Union Members, 2025 (Current Population Survey), table 5.
Cities in Virginia
All trades in Virginia.