Home › Telecom Equipment Installer › California

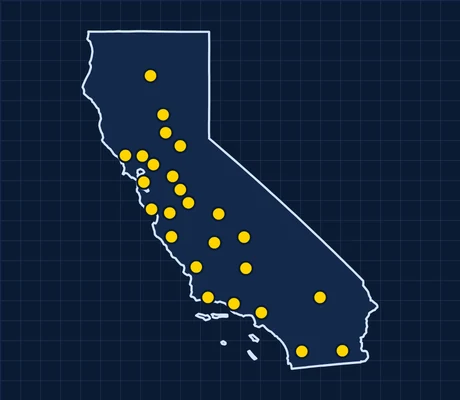
Map of California showing 25 metro areas with skilled trade pay data
California: 25 metros with trade pay data

Telecom Equipment Installer pay in California

Statewide and by city · BLS, May 2025

$76,630statewide median a year
$36.84median an hour
#9of 50 states + DC
14,040telecom equipment installers employed statewide

Statewide pay Government data

Telecom equipment installers in California earn a statewide median of $76,630 a year, 23% above the typical U.S. metro, ranking #9 of 50 states and DC. About 14,040 people work in the trade statewide.

Statewide pay range

$56,410Entry · 10th$65,48025th$76,630Median$97,40075th$113,240Top · 90th

States ranked near California

Hawaii$79,250
New Jersey$78,000
Washington$77,610
California$76,630
Colorado$76,410
Oregon$75,270

See all states on the telecom equipment installer overview.

Pay by city Government data

BLS publishes telecom equipment installer pay for 24 California metros: Bakersfield, Chico, El Centro, Fresno, Hanford, Los Angeles, Merced, Modesto, Oxnard, Redding, Riverside, Sacramento, Salinas, San Diego, San Francisco, San Jose, San Luis Obispo, Santa Cruz, Santa Maria, Santa Rosa, Stockton, Vallejo, Visalia and Yuba City.

MetroMedian payReal payJobs
San FranciscoCALIFORNIA · CA$92,290$79,8271,850
El CentroCALIFORNIA · CA$89,600$94,14350
San JoseCALIFORNIA · CA$87,950$79,6481,060
Yuba CityCALIFORNIA · CA$86,140$82,64240
Santa CruzCALIFORNIA · CA$83,030$75,55360
Santa RosaCALIFORNIA · CA$79,410$73,675120
SalinasCALIFORNIA · CA$77,890$71,43190
San DiegoCALIFORNIA · CA$76,970$68,7931,030
Santa MariaCALIFORNIA · CA$75,690$69,569110
ChicoCALIFORNIA · CA$75,190$74,30140
San Luis ObispoCALIFORNIA · CA$74,970$69,03690
VallejoCALIFORNIA · CA$74,240$68,437140
SacramentoCALIFORNIA · CA$73,990$69,3631,060
OxnardCALIFORNIA · CA$73,480$66,477290
Los AngelesCALIFORNIA · CA$73,440$64,6674,360
RiversideCALIFORNIA · CA$72,770$68,3661,340
StocktonCALIFORNIA · CA$72,520$69,008200
MercedCALIFORNIA · CA$71,700$72,95940
VisaliaCALIFORNIA · CA$71,700$71,826100
HanfordCALIFORNIA · CA$71,480$70,34630
ModestoCALIFORNIA · CA$71,460$68,640150
FresnoCALIFORNIA · CA$71,300$69,794420
BakersfieldCALIFORNIA · CA$69,850$69,237110
ReddingCALIFORNIA · CA$66,800$66,34690

Pay: BLS OEWS, May 2025 (metro-level). Real pay: BEA price parities, 2024. How we calculate

Pay outside the cities Government data

BLS also reports pay for California's rural (nonmetropolitan) regions.

North Coast Region of California$78,390
North Valley-Northern Mountains Region of California$74,090
Eastern Sierra-Mother Lode Region of California$71,630

BLS OEWS nonmetropolitan areas, May 2025.

The job (national)
Blueprint-style drawing of an electrical panel feeding branch circuits, illustrating telecom equipment installer work in California
Telecom Equipment Installer pay in California: $76,630 statewide median, BLS May 2025.

Install, set up, rearrange, or remove switching, distribution, routing, and dialing equipment used in central offices or headends. Service or repair telephone, cable television, Internet, and other communications equipment on customers' property. May install communications equipment or communications wiring in buildings.

Nationally, jobs are projected to shrink 3.3% from 2025 to 2035, with about 11,300 openings a year. Typical training: moderate-term on-the-job training.

Nationally, telecom equipment installers have 168 injuries or illnesses serious enough to miss work per 10,000 full-time workers, 1.9× the rate for all jobs (87). The most common cause is overexertion and repetitive strain.

What the work is like Government data

How often telecom equipment installers deal with each condition, from surveys of workers in the job.

Outdoors, in all kinds of weatherOften
Indoors with heating and air conditioningOften
Very hot or cold conditionsOften
Working at heightsOften
Climbing ladders, scaffolds or polesOccasionally
Cramped spaces and awkward positionsSometimes
Loud noiseSometimes
Hazardous conditionsOccasionally
Standing, bending, kneeling and walkingSometimes
SittingOccasionally

Getting started usually takes medium preparation (vocational training or an apprenticeship, often 1–2+ years).

O*NET 31.0 Work Context and Job Zones (U.S. Department of Labor), national.

Registered apprenticeships Government data

Of telecom equipment installer apprentices in California who finished or left a registered program in fiscal years 2020–2024, 66% completed (U.S.: 44%), about 214 graduates a year. The typical program runs 4,800 hours, about 2 years of full-time work. Union programs had a 69% completion rate, compared with 60% for non-union programs.

U.S. Department of Labor, RAPIDS apprentice records (Completion Rate Analysis), FY2020–2024 exits.

Licensing in California Official source

The main state licensing office in California is the Contractors State License Board. Licenses all trades by classification (e.g. C-10 electrical; C-36 plumbing). It can point you to the right license for telecom equipment installers.

Official California licensing site ↗

Requirements for telecom equipment installers vary by state and sometimes by city; always confirm with the official agency.

Union membership

In 2025, 14.9% of wage and salary workers in California were union members, above the U.S. rate of about 10% (#8 of 51 states and D.C.), and 16.7% were covered by a union contract. These figures cover all jobs in the state, not only telecom equipment installers.

BLS Union Members, 2025 (Current Population Survey), table 5.

Cities in California

San FranciscoCALIFORNIA · CA-2.4%population since 2020 · 4.4% unemployment
El CentroCALIFORNIA · CA+1.0%population since 2020 · 18.9% unemployment
San JoseCALIFORNIA · CA-0.6%population since 2020 · 4.3% unemployment
Yuba CityCALIFORNIA · CA+3.3%population since 2020 · 8.1% unemployment
Santa CruzCALIFORNIA · CA-4.7%population since 2020 · 6.3% unemployment
Santa RosaCALIFORNIA · CA-0.4%population since 2020 · 4.4% unemployment
SalinasCALIFORNIA · CA-1.5%population since 2020 · 7.9% unemployment
San DiegoCALIFORNIA · CA-0.6%population since 2020 · 4.6% unemployment
Santa MariaCALIFORNIA · CA-1.4%population since 2020 · 4.8% unemployment
ChicoCALIFORNIA · CA-0.5%population since 2020 · 6.2% unemployment
San Luis ObispoCALIFORNIA · CA+0.0%population since 2020 · 4.4% unemployment
VallejoCALIFORNIA · CA+0.5%population since 2020 · 5.3% unemployment
SacramentoCALIFORNIA · CA+3.1%population since 2020 · 5.0% unemployment
OxnardCALIFORNIA · CA-1.5%population since 2020 · 4.8% unemployment
Los AngelesCALIFORNIA · CA-2.6%population since 2020 · 5.3% unemployment
RiversideCALIFORNIA · CA+3.5%population since 2020 · 5.5% unemployment
StocktonCALIFORNIA · CA+5.5%population since 2020 · 6.7% unemployment
MercedCALIFORNIA · CA+5.1%population since 2020 · 10.2% unemployment
VisaliaCALIFORNIA · CA+2.4%population since 2020 · 10.8% unemployment
HanfordCALIFORNIA · CA+1.0%population since 2020 · 9.3% unemployment
ModestoCALIFORNIA · CA+0.7%population since 2020 · 7.2% unemployment
FresnoCALIFORNIA · CA+3.2%population since 2020 · 8.4% unemployment
BakersfieldCALIFORNIA · CA+2.3%population since 2020 · 9.0% unemployment
ReddingCALIFORNIA · CA-0.3%population since 2020 · 5.5% unemployment

All trades in California.

Top