Statewide pay Government data
Welders in Washington earn a statewide median of $63,020 a year, 21% above the typical U.S. metro, ranking #5 of 50 states and DC. About 7,720 people work in the trade statewide.
Statewide pay range
States ranked near Washington
See all states on the welders nationwide.
Pay by city Government data
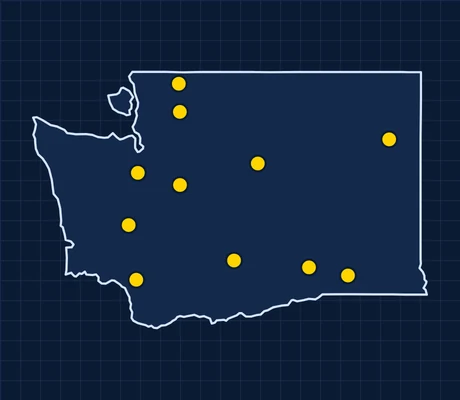
BLS publishes welder pay for 11 Washington metros. The highest-paying is Bremerton at $71,720, followed by Seattle and Kennewick.
| Metro | Median pay | Real pay | Jobs |
|---|---|---|---|
| BremertonWASHINGTON · WA | $71,720 | $67,912 | 740 |
| SeattleWASHINGTON · WA | $66,240 | $59,604 | 3,230 |
| KennewickWASHINGTON · WA | $64,720 | $64,669 | 260 |
| BellinghamWASHINGTON · WA | $63,720 | $61,664 | 320 |
| Mount VernonWASHINGTON · WA | $62,800 | $61,302 | 430 |
| LongviewWASHINGTON · WA | $59,860 | $61,367 | 120 |
| Walla WallaWASHINGTON · WA | $59,380 | $60,273 | 80 |
| SpokaneWASHINGTON · WA | $59,350 | $59,145 | 630 |
| OlympiaWASHINGTON · WA | $58,680 | $56,603 | 140 |
| YakimaWASHINGTON · WA | $57,450 | $60,129 | 290 |
| WenatcheeWASHINGTON · WA | $49,780 | $47,932 | 90 |
Pay: BLS OEWS, May 2025 (metro-level). Real pay: BEA price parities, 2024. How we calculate
Pay outside the cities Government data
BLS also reports pay for Washington's rural (nonmetropolitan) regions.
BLS OEWS nonmetropolitan areas, May 2025.
The job (national)

Use hand-welding, flame-cutting, hand-soldering, or brazing equipment to weld or join metal components or to fill holes, indentations, or seams of fabricated metal products.
Nationally, jobs are projected to grow 2.4% from 2025 to 2035, with about 40,300 openings a year. Typical training: moderate-term on-the-job training.
Nationally, welders have 43 injuries or illnesses serious enough to miss work per 10,000 full-time workers, 50% below the rate for all jobs (87). The most common cause is being struck by or caught in objects and equipment.
What the work is like Government data
How often welders deal with each condition, from surveys of workers in the job.
Getting started usually takes some preparation (high school plus months of training).
O*NET 31.0 Work Context and Job Zones (U.S. Department of Labor), national.
Registered apprenticeships Government data
Of welder apprentices in Washington who finished or left a registered program in fiscal years 2020–2024, 82% completed (U.S.: 58%), about 15 graduates a year. The typical program runs 8,000 hours, about 4 years of full-time work. Search open registered programs near you on the official Apprenticeship Finder.
U.S. Department of Labor, RAPIDS apprentice records (Completion Rate Analysis), FY2020–2024 exits.
Licensed contractors Government data
Washington had 203 active welding and ornamental metal contractor licenses in October 2026. Washington requires every construction contractor to register with L&I, so the count covers specialty firms, not only licensed trades.
Washington Department of Labor & Industries, contractor license data, October 2026 (active licenses only).
Serious injuries & deaths reported to OSHA Government data
Washington runs its own workplace-safety program (an OSHA State Plan), so its injury reports aren't in the federal dataset. Nationally, in states federal OSHA covers, metal fabrication plants filed 4,763 severe injury reports from 2015 to 2024; the most common cause was contact with objects and equipment (77%).
OSHA Severe Injury Reports, January 2015–December 2024 (states under federal OSHA only).
Fatality investigations: OSHA Fatality Inspection Data, events 2015–2024, all states.
Where to train in Washington Government data
24 schools in Washington offer precision metal working (welding, machining, sheet metal) programs below the bachelor's level, 23 of them at public colleges. Many people in this trade learn through an apprenticeship instead; a program can shorten it or get you hired as a helper.
Where published, graduates earned a median of $47,948 in their first year out.
| School | Credential | Yearly cost | Recent grads | First-year pay |
|---|---|---|---|---|
| Peninsula College Port Angeles, WA · Public | Certificate | $28,787 | 173 | — |
| Clark College Vancouver, WA · Public | Certificate | $27,779 | 86 | — |
| South Puget Sound Community College Olympia, WA · Public | Certificate | $28,208 | 81 | — |
| Everett Community College Everett, WA · Public | Certificate | $27,616 | 80 | — |
| Bellingham Technical College Bellingham, WA · Public | Certificate | $27,015 | 52 | — |
| Spokane Community College Spokane, WA · Public | Certificate | $28,709 | 48 | $38,996 |
| South Seattle College Seattle, WA · Public | Certificate | $29,898 | 47 | — |
| Perry Technical Institute Yakima, WA · Private nonprofit | Certificate | $30,780 | 44 | $47,948 |
U.S. Department of Education College Scorecard (data updated October 2026). Cost is the school's average yearly cost of attendance before financial aid; earnings are the median for graduates one year after finishing, shown only where the school has enough graduates to publish. “—” means not published.
Licensing in Washington Official source
The main state licensing office in Washington is the Washington State Department of Labor & Industries. It can point you to the right license for welders.
Official Washington licensing site ↗
Requirements for welders vary by state and sometimes by city; always confirm with the official agency.
Union membership
In 2025, 18.0% of wage and salary workers in Washington were union members, above the U.S. rate of about 10% (#4 of 51 states and D.C.), and 19.4% were covered by a union contract. These figures cover all jobs in the state, not only welders.
BLS Union Members, 2025 (Current Population Survey), table 5.
Cities in Washington
All trades in Washington.